How to debug Java applications like console, Swing, AWT, JavaFX and Spring Boot applications?
Learn on YouTube- https://www.youtube.com/watch?v=maWo73QV23o&t=118s
- Open CoreIDE.
- Open your project.
- Go to Run/Debug tab.
- Click on Add (+) button it will open a new window. Here you can create your new run/debug configuration.
-
Go to Java tab in the new window.
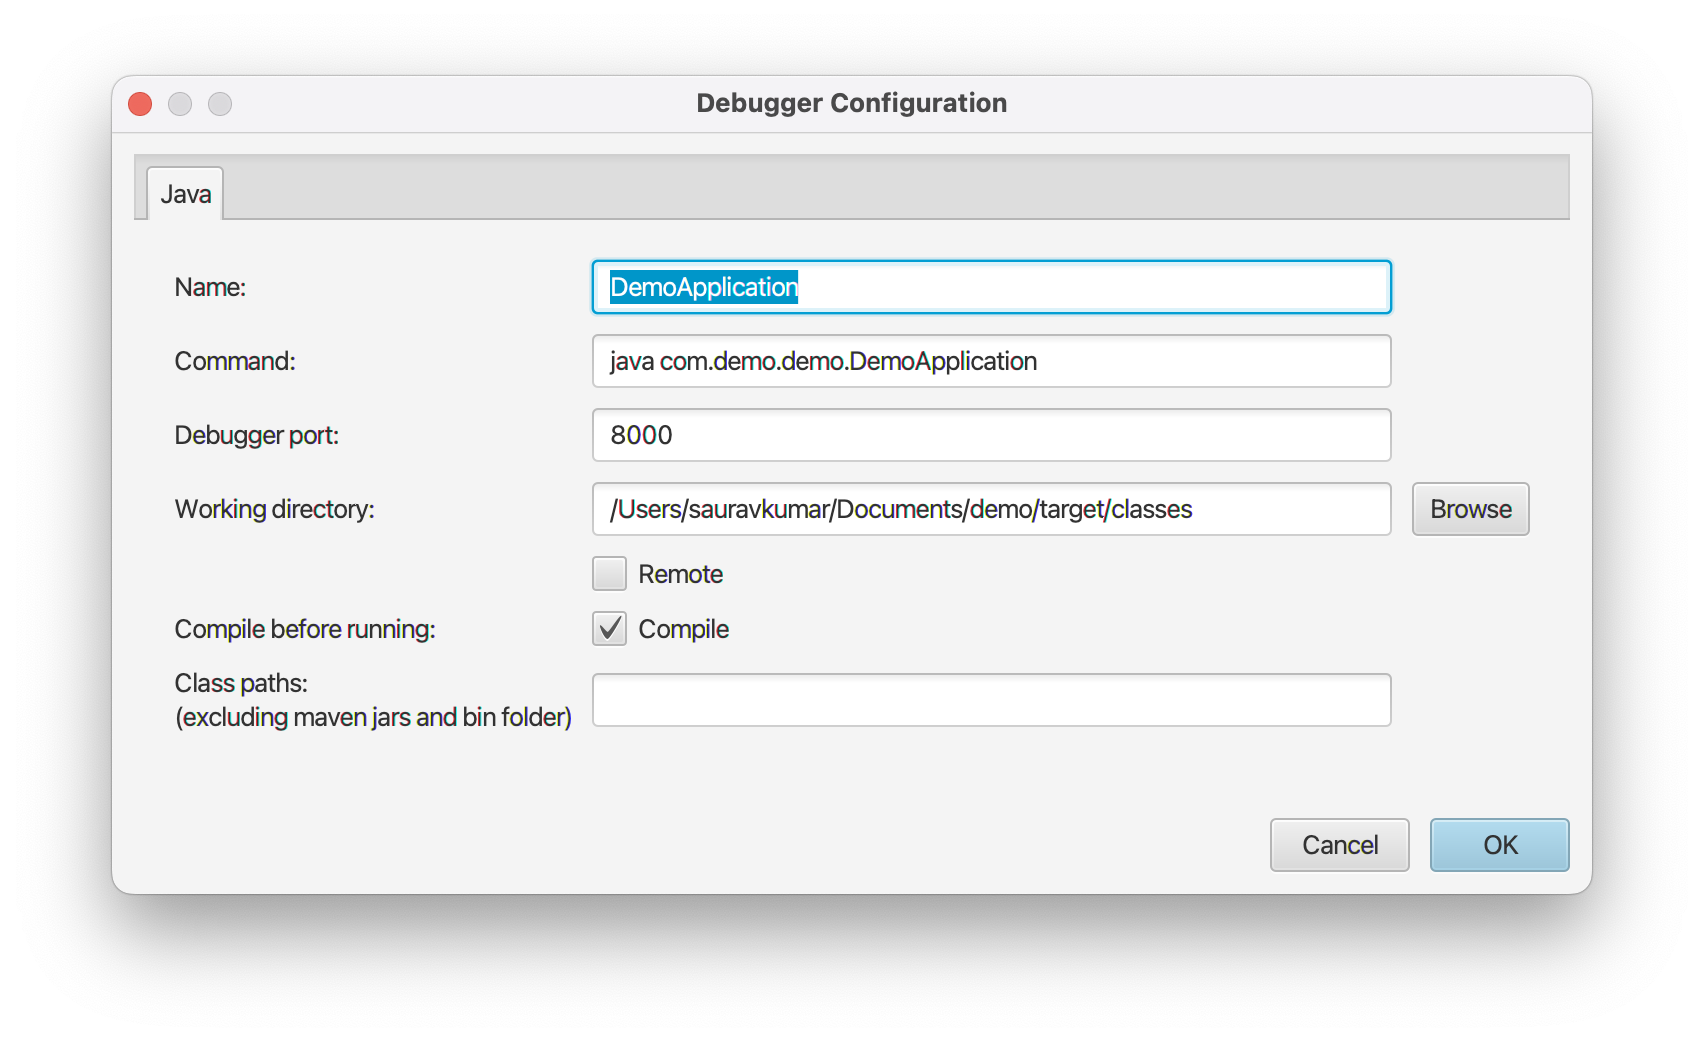
- Enter unique configuration name.
- Enter the command for example “java com.demo.Main”. Make sure that your JDK path is set properly in Settings. No need to include Java classpath in command it will get auto populated including Maven dependency JARs and Java binary location. You can include JVM parameters in the command itself and add external classpath dependencies in classpath textbox.
- Enter desired port number or leave default.
- If you want the IDE to compile your Java code when you run this configuration then check the compile checkbox and select the output bytecode version.
- Configure other fields as needed.
- Click on Save button.
-
Now you can select your configuration from the dropdown and click on Run or Debug buttons to start.
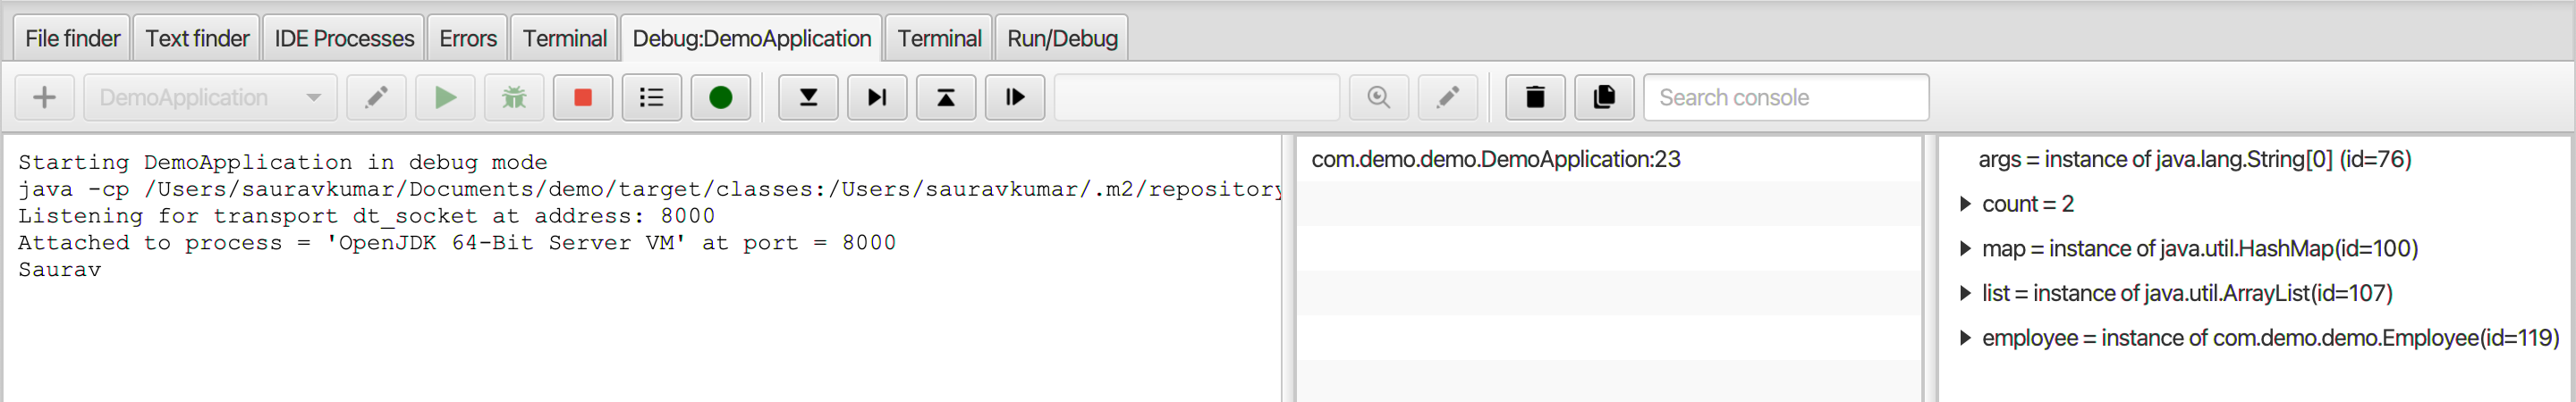
- You can hover your cursor over the buttons to know the purpose and keyboard shortcut of a button.
-
You can go to any Java file in the project and click on sidebar to add breakpoints.
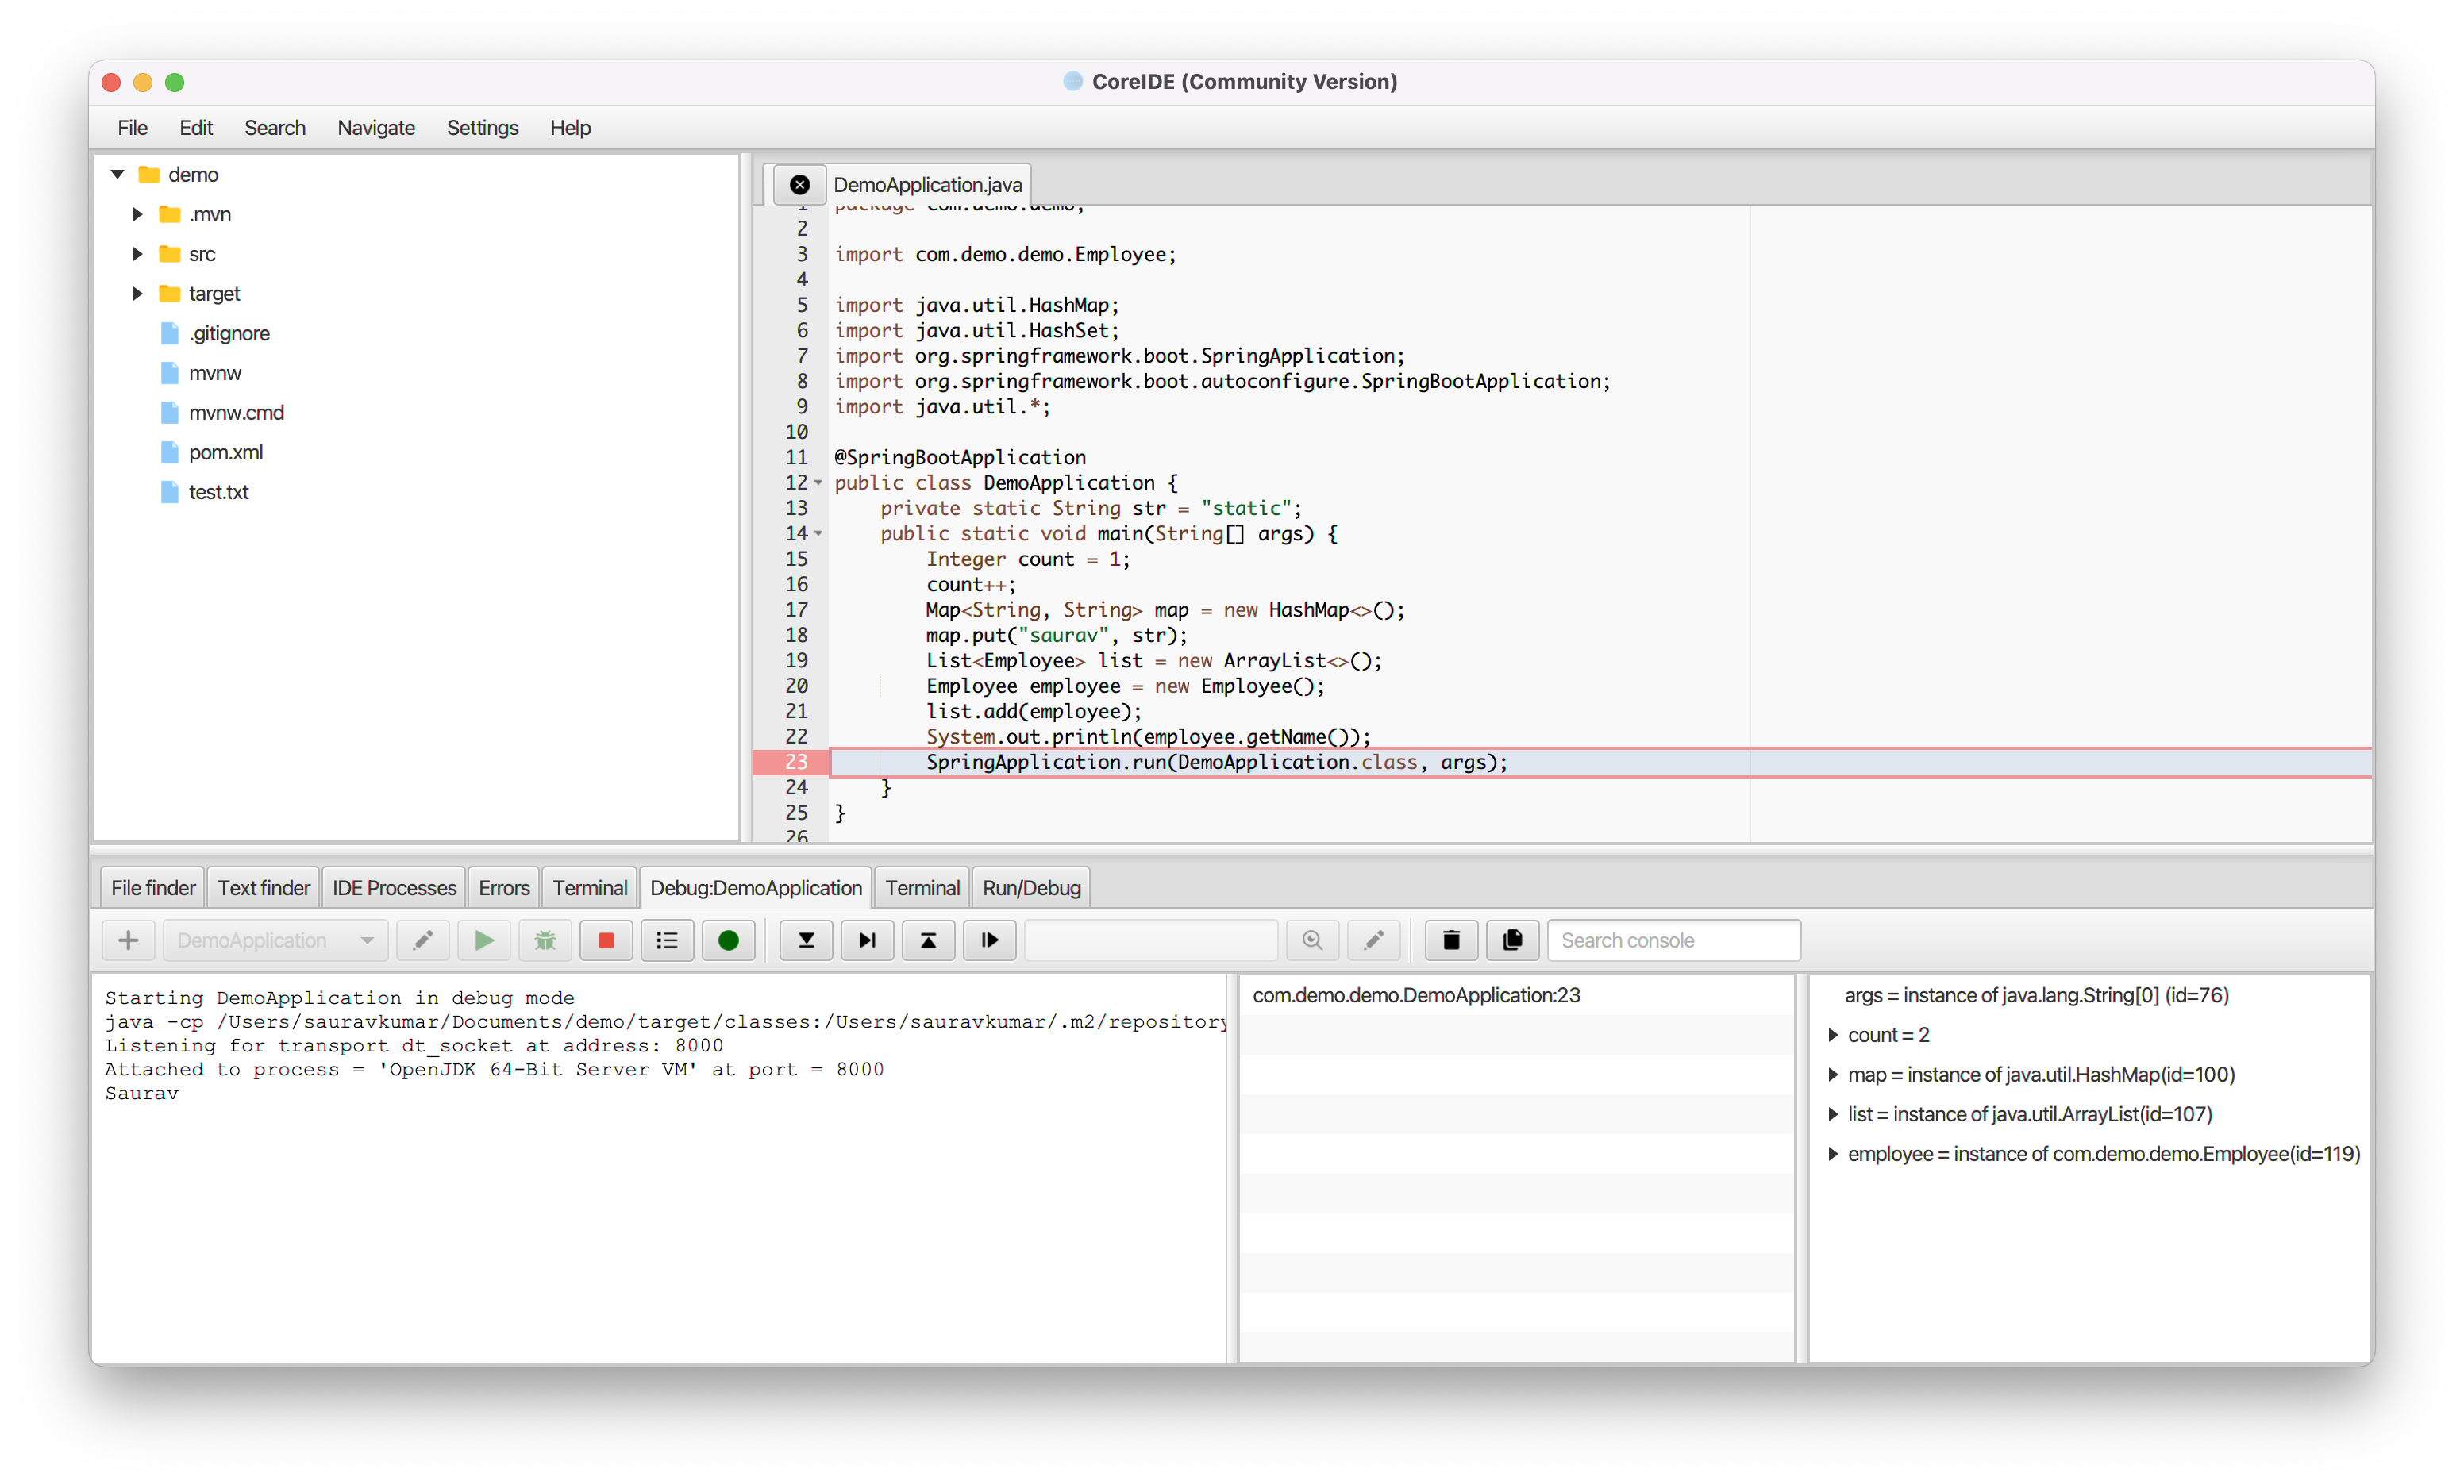
- You can launch the debugger by pressing the () button.
Need more help? Please visit the CoreIDE Wiki for more articles. You can also report an issue or request a new feature.