How to debug JavaScript or Node.js applications?
Learn on YouTube- https://www.youtube.com/watch?v=maWo73QV23o&t=380s
- Open CoreIDE.
- Open your project.
- Go to Run/Debug tab.
- Click on Add (+) button it will open a new window. Here you can create your new run/debug configuration.
-
Go to JavaScript tab in the new window.
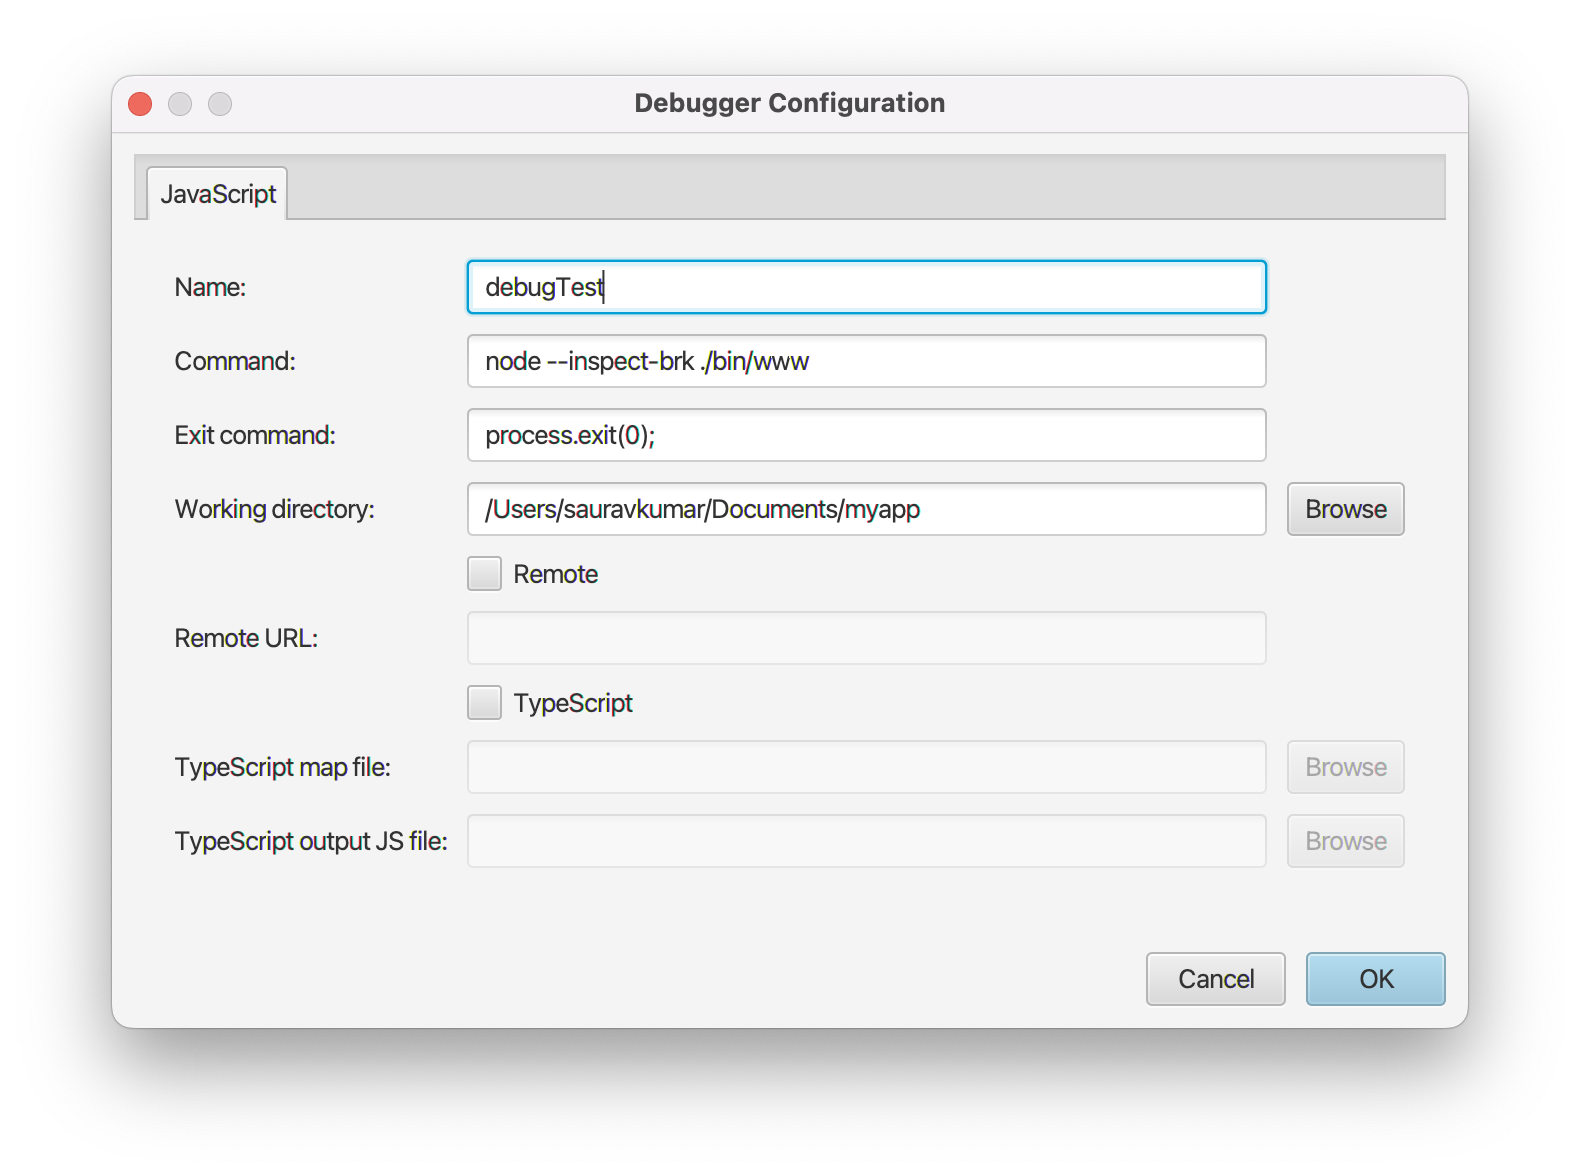
- Enter unique configuration name.
- Enter the command for example “node app.js --inspect-brk”. Make sure that your Node.js installation bin path is configured properly in system environment variables otherwise you will need to enter full path of node installation.
- Configure other fields as needed.
- Click on Save button.
-
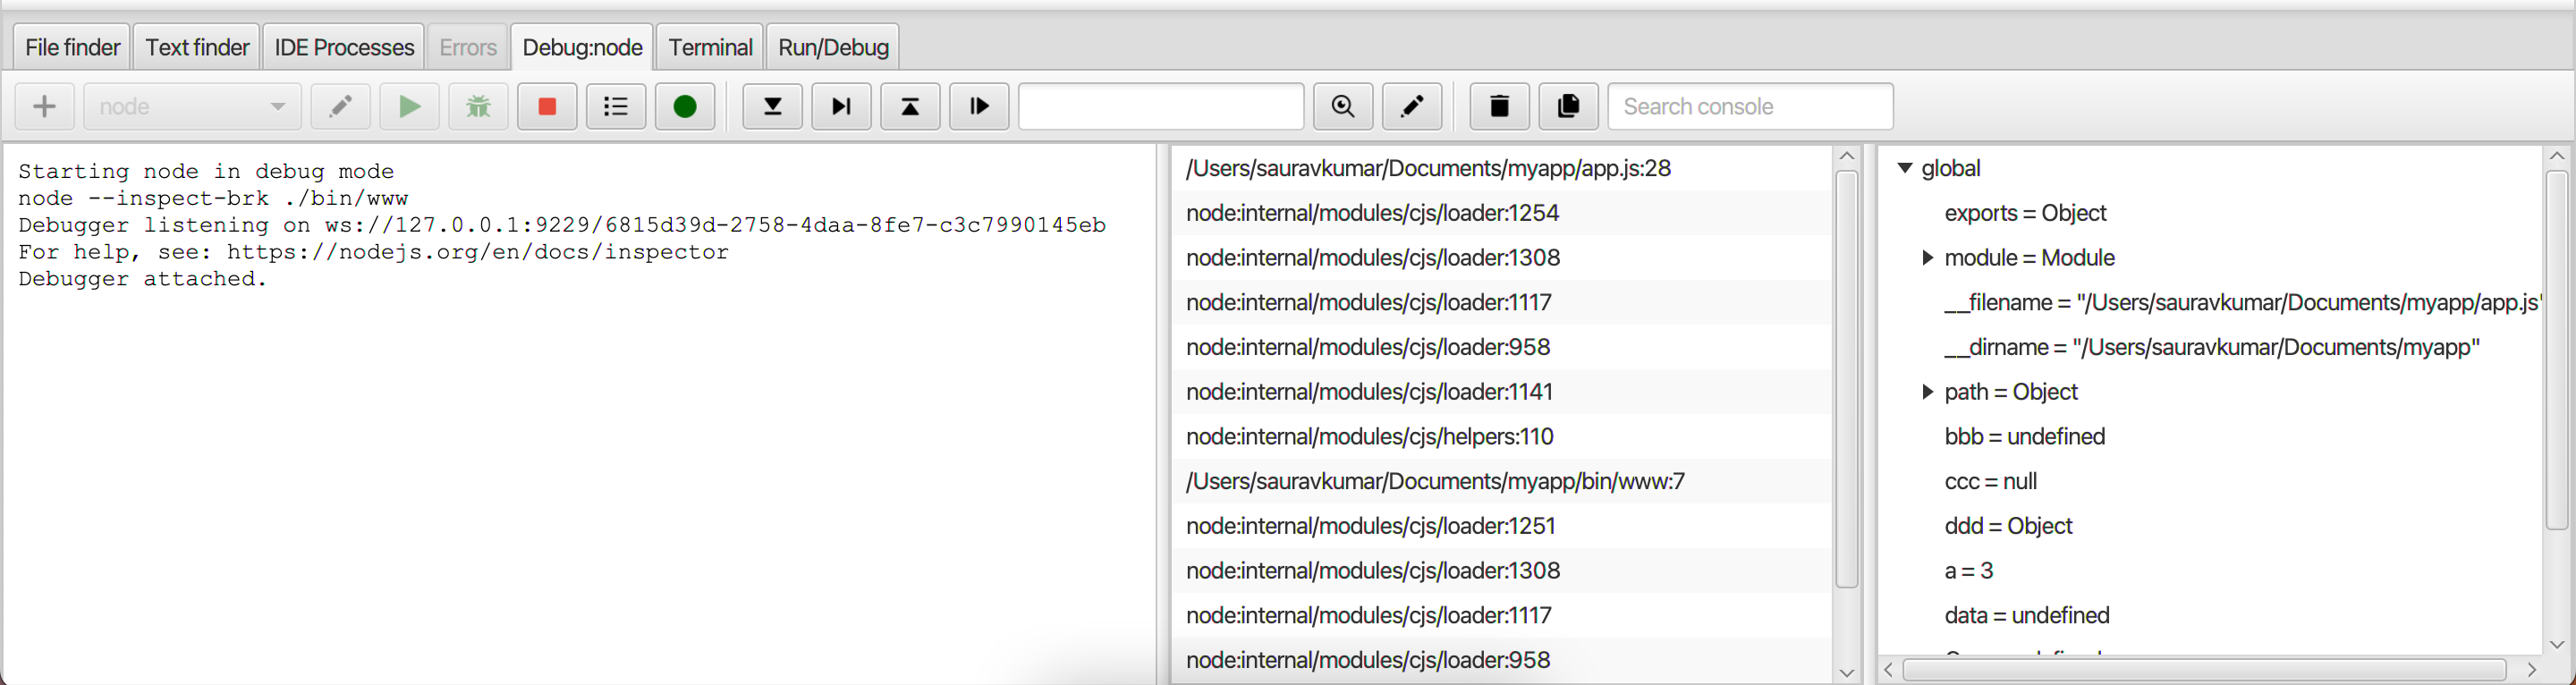
Now you can select your configuration from the dropdown and click on Run or Debug buttons to start.
- You can hover your cursor over the buttons to know the purpose and keyboard shortcut of a button.
-
You can go to any Java file in the project and click on sidebar to add breakpoints.
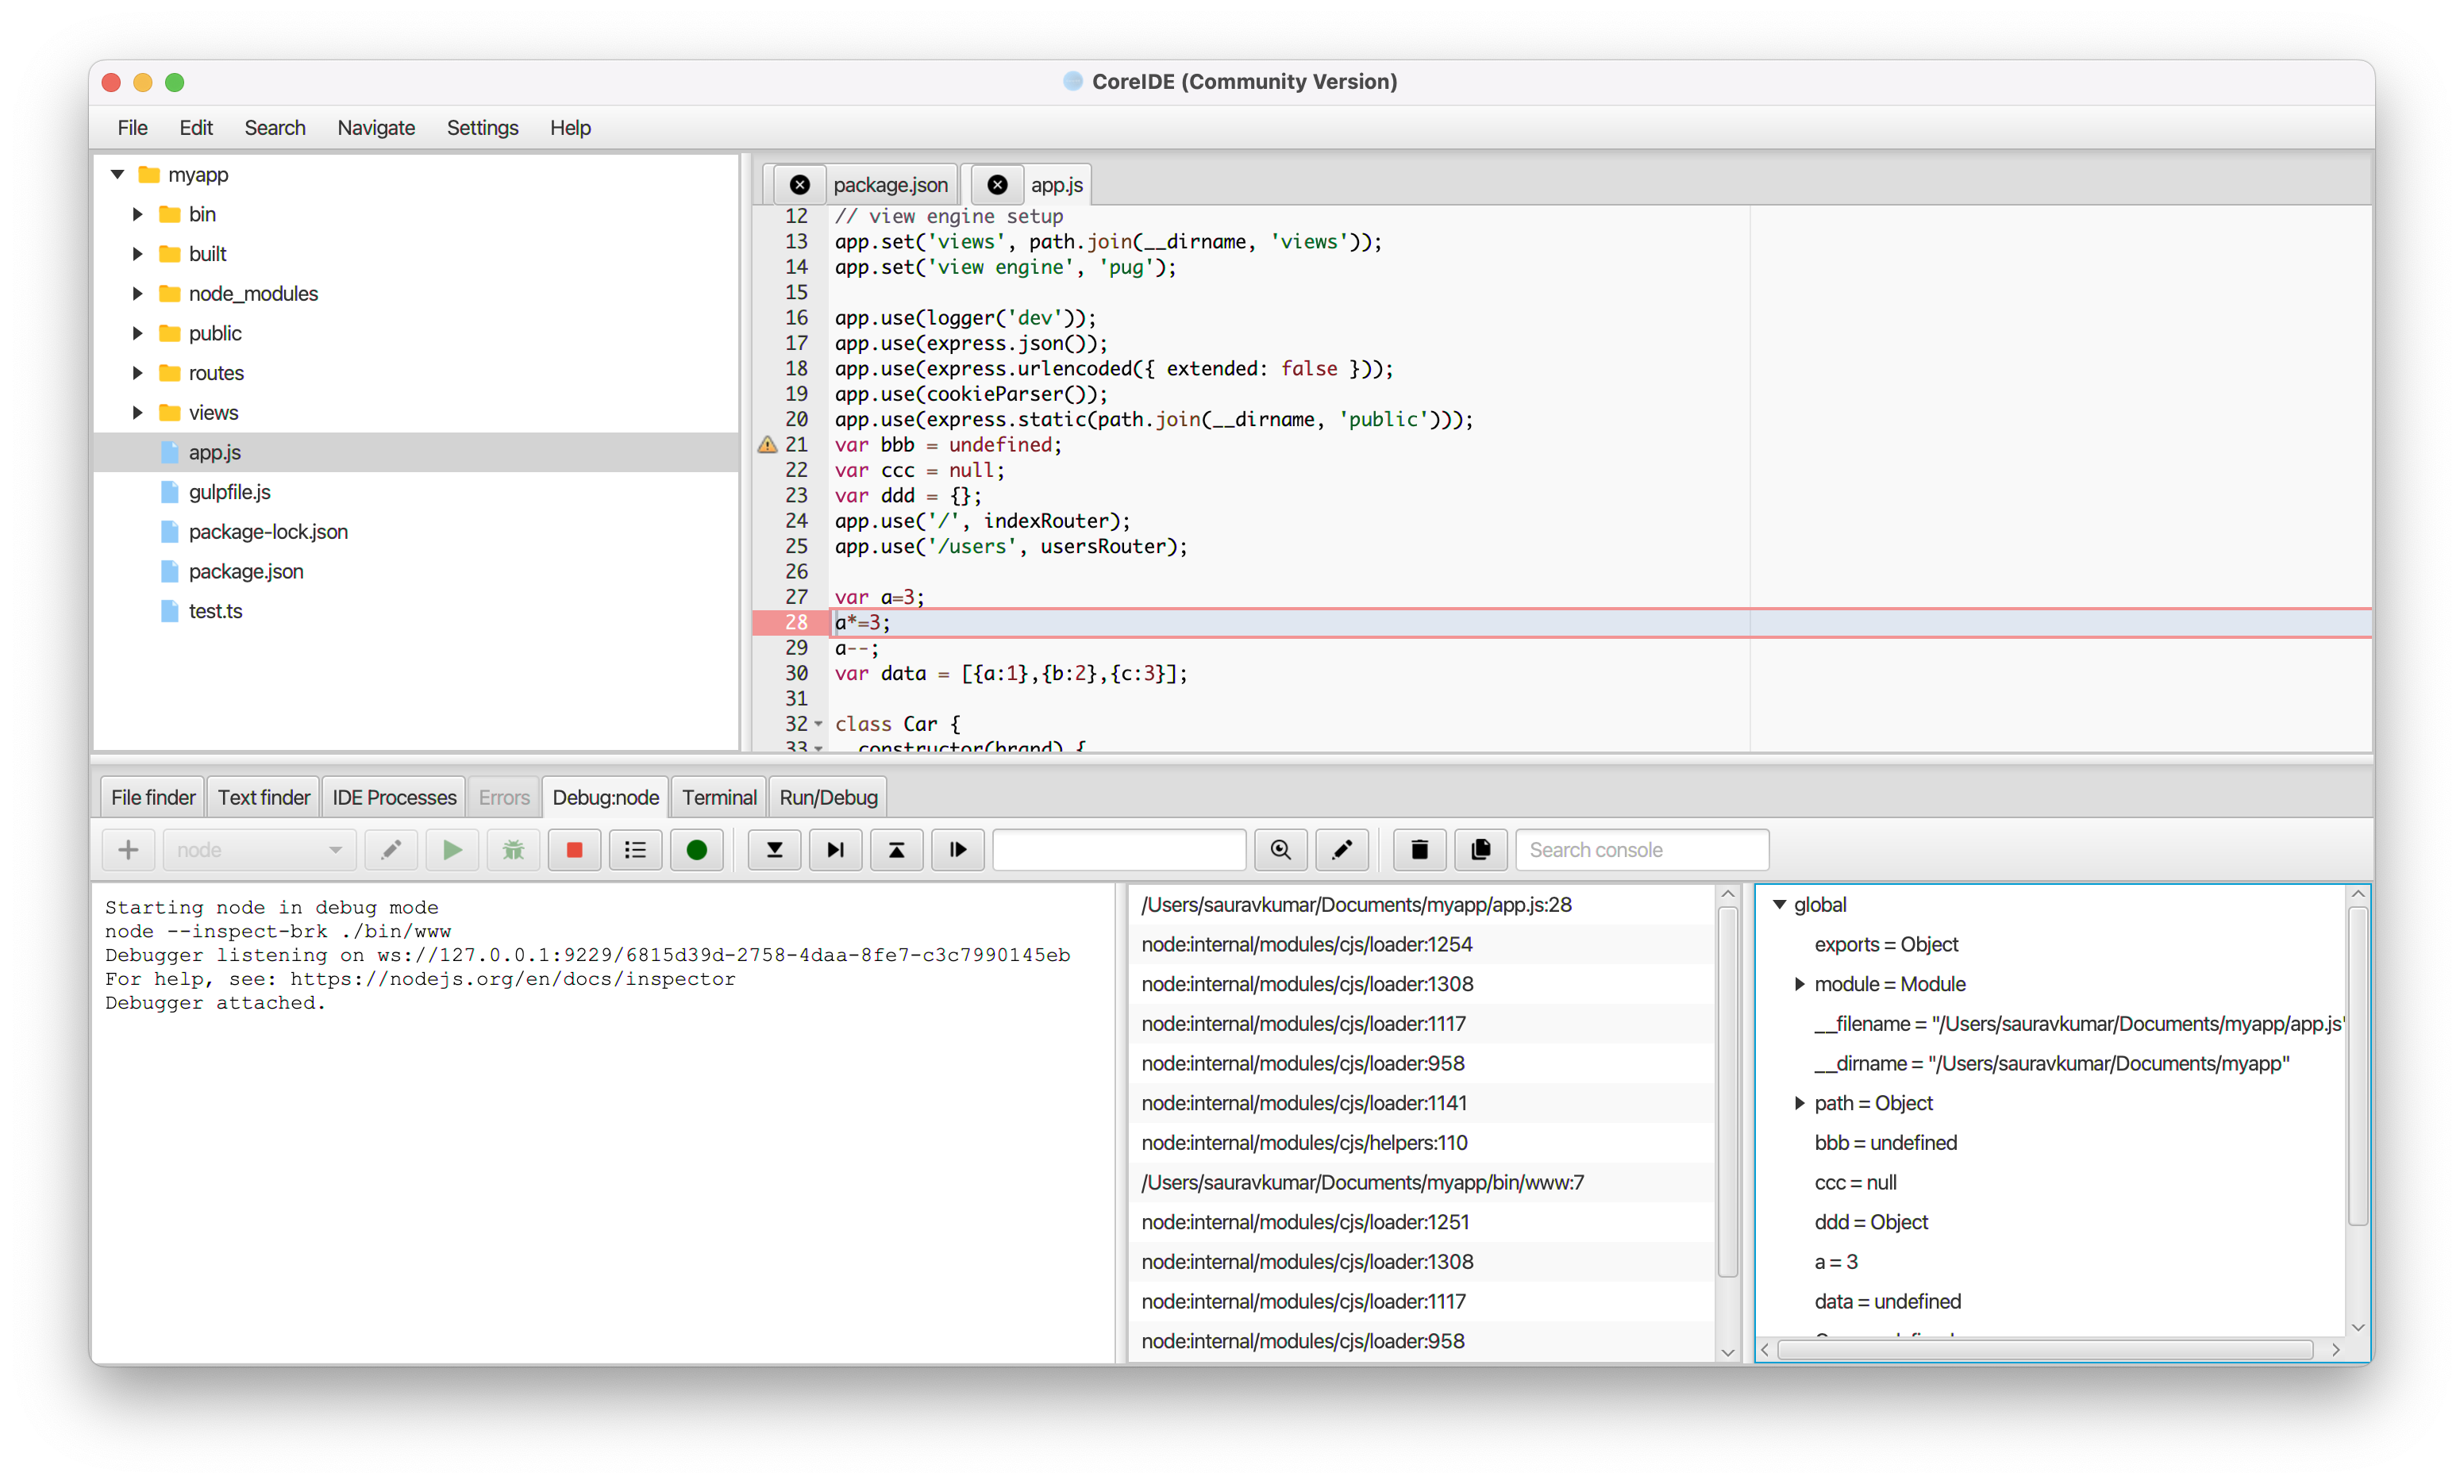
- You can launch the debugger by pressing the () button.
Need more help? Please visit the CoreIDE Wiki for more articles. You can also report an issue or request a new feature.