How to debug remote TypeScript application?
Learn on YouTube- https://www.youtube.com/watch?v=maWo73QV23o&t=477s
- You will need to configure your TypeScript compiler to provide compiled JavaScript file along with the mapping file. Make sure that you have started your compiled JavaScript application with the debugger parameter like “--inspect-brk”. Your application will print a WebSocket URL like “Debugger listening on ws://127.0.0.1:9229/bb6eed9d-19d4–47ae-99cf-2f2a09e125ef” in the console, copy it.
- Open CoreIDE.
- Open your project.
- Go to Run/Debug tab.
- Click on Add (+) button it will open a new window. Here you can create your new run/debug configuration.
-
Go to JavaScript tab in the new window.
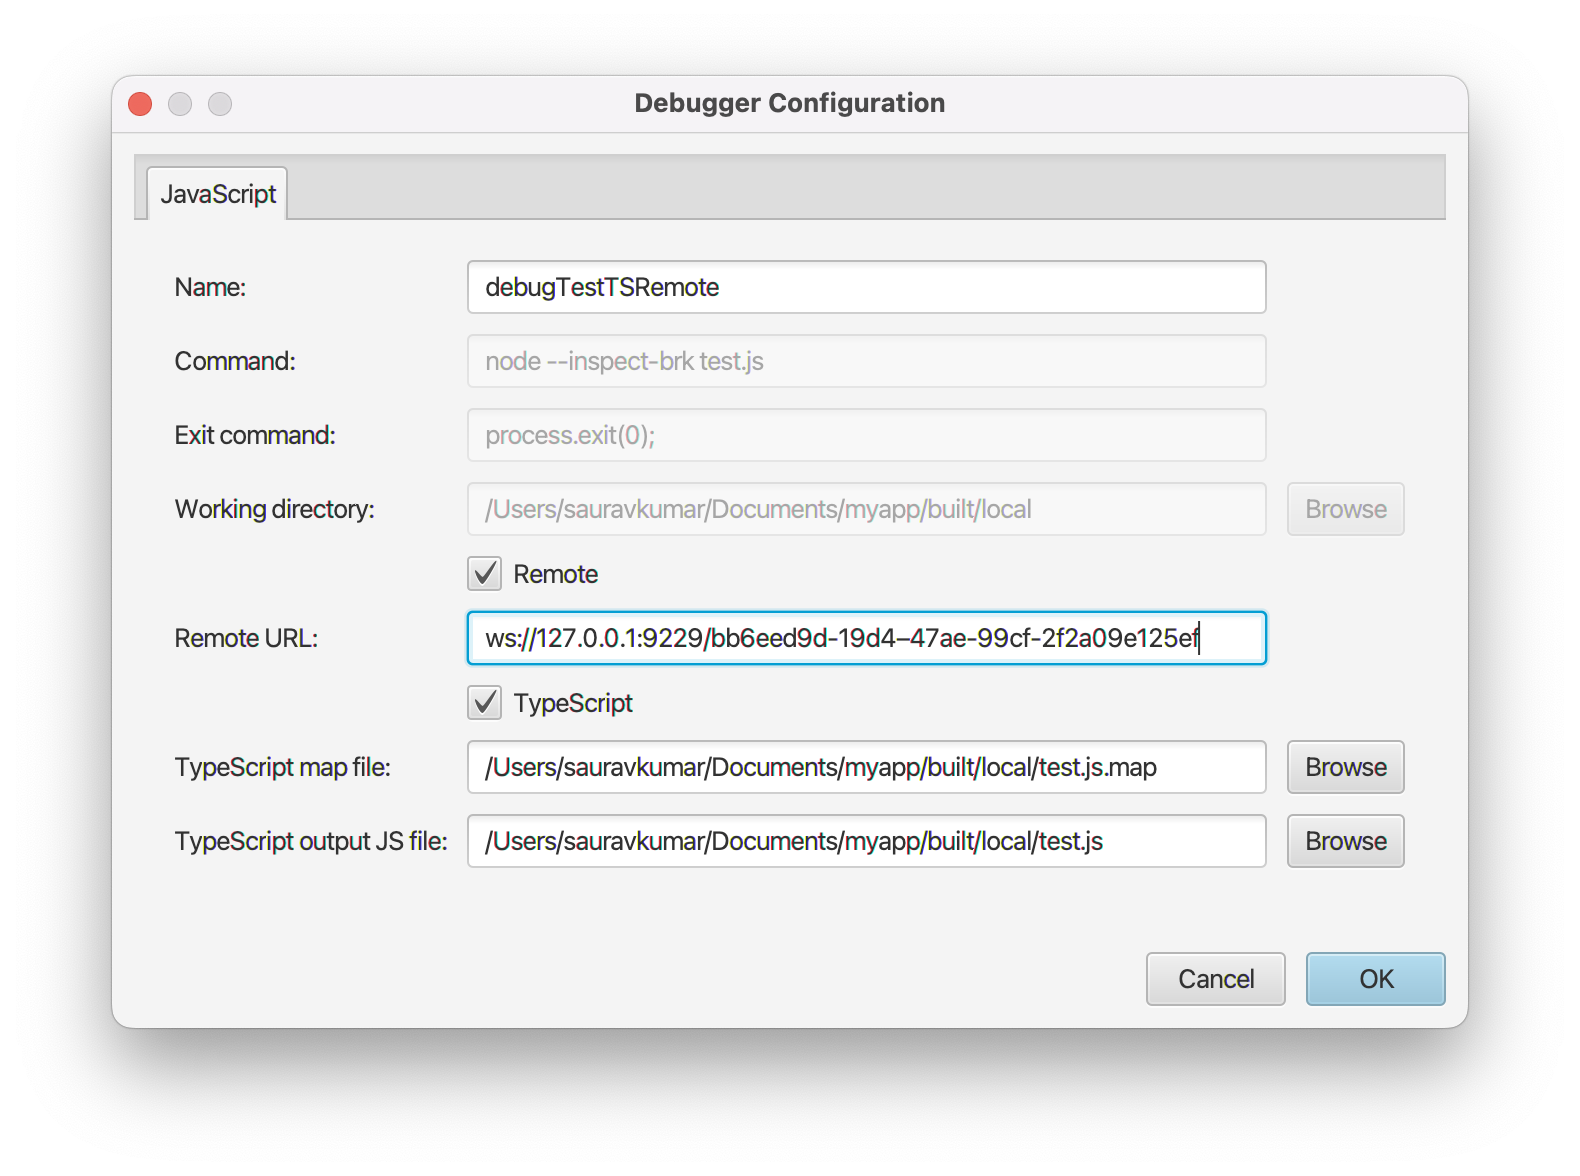
- Enter unique configuration name.
- Check the remote checkbox.
- Enter the WebSocket URL copied in the first step.
- Check TypeScript checkbox.
- Enter the path for compiled/output JavaScript file and the mapping file.
- Configure other fields as needed.
- Click on Save button.
-
Now you can select your configuration from the dropdown and click on Run or Debug buttons to start.
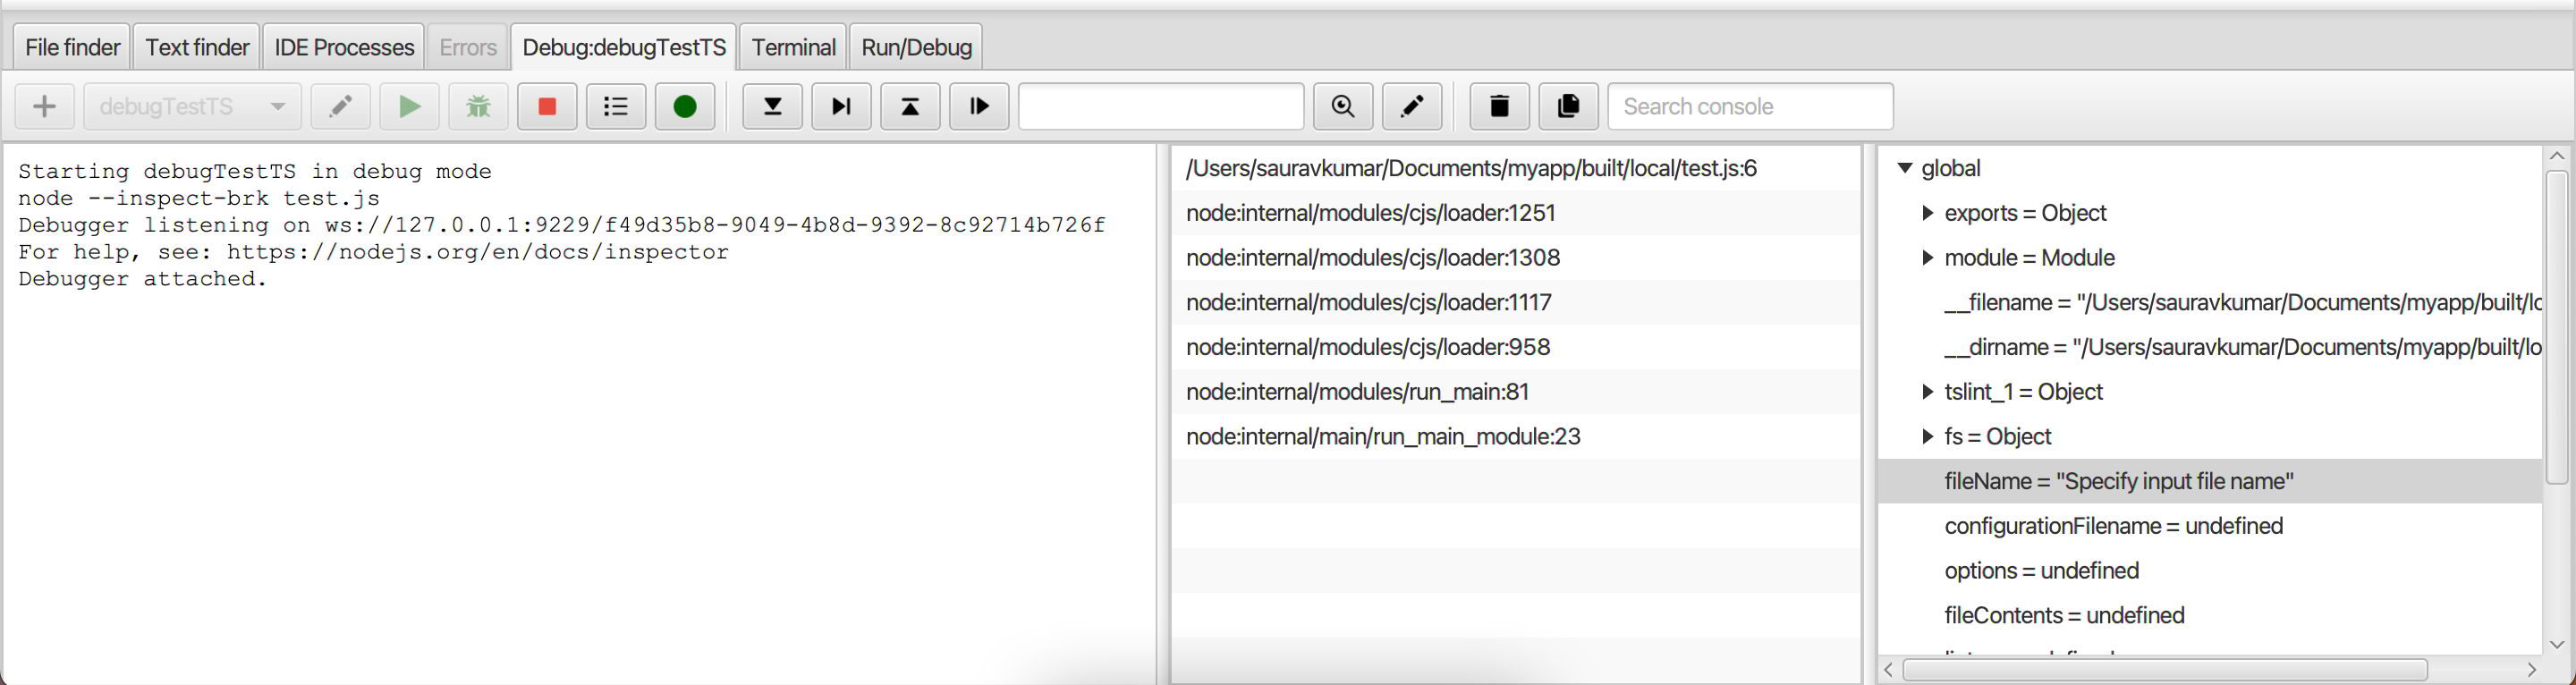
- You can hover your cursor over the buttons to know the purpose and keyboard shortcut of a button.
-
You can go to any Java file in the project and click on sidebar to add breakpoints.
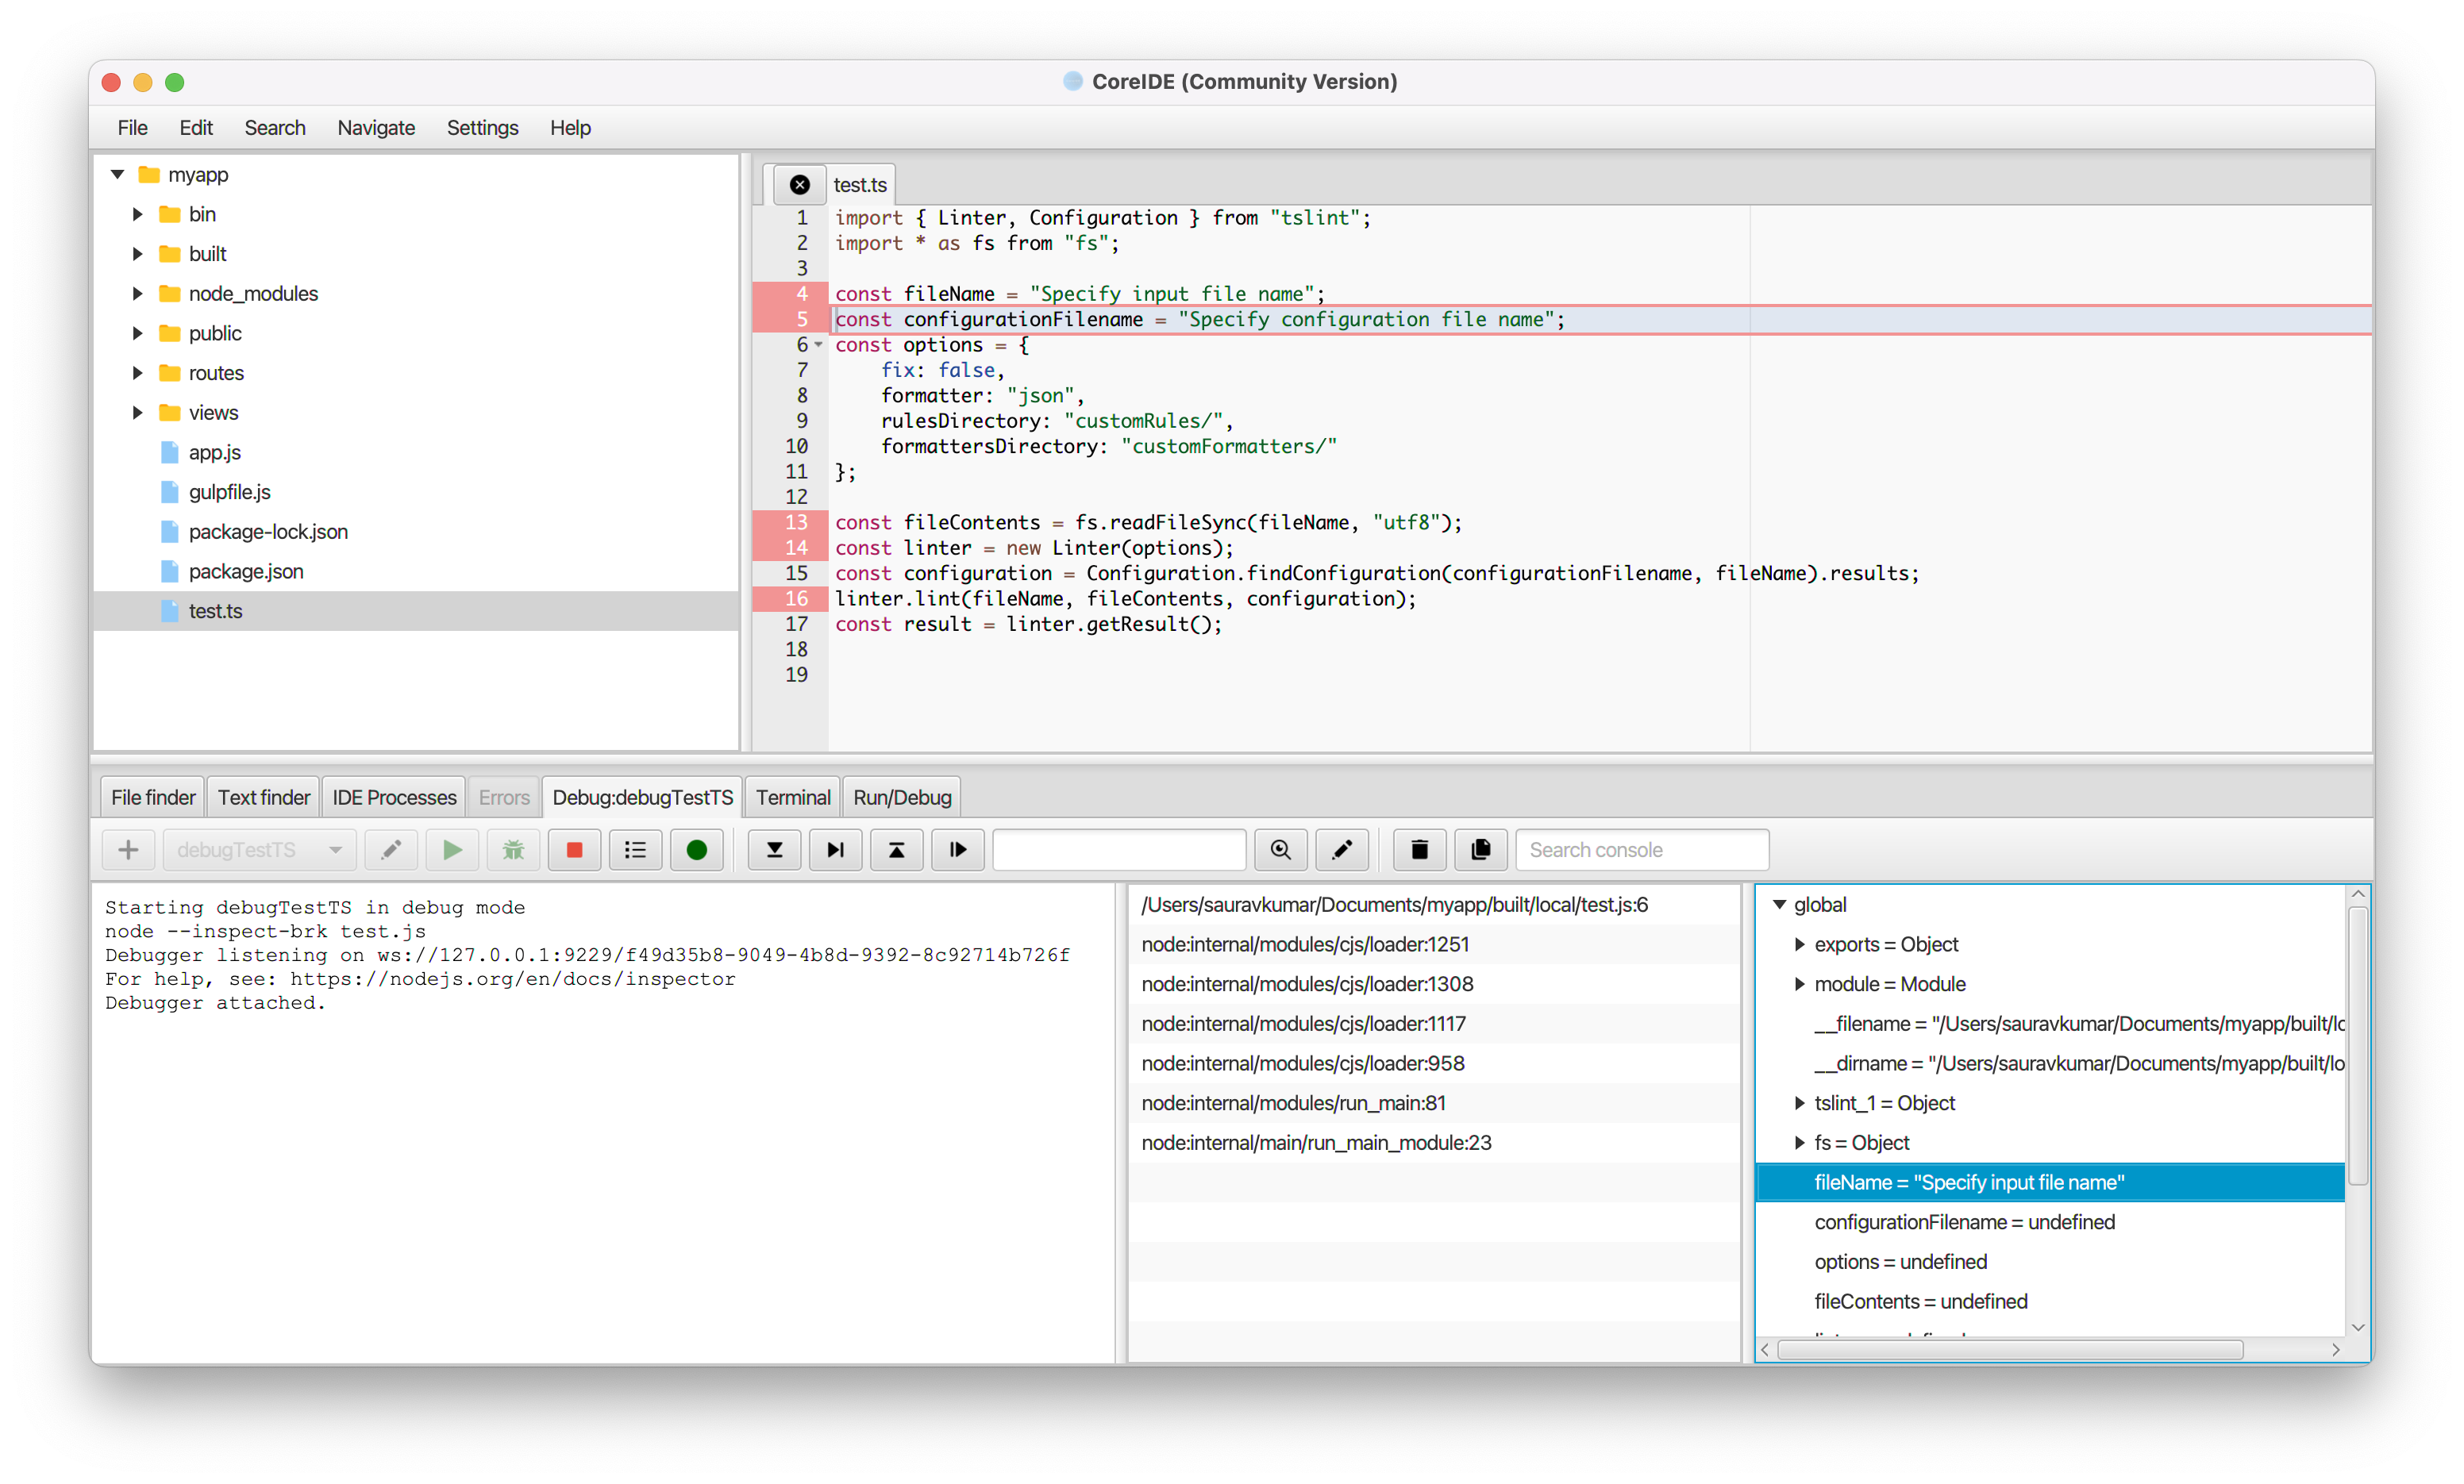
- You can launch the debugger by pressing the () button.
Need more help? Please visit the CoreIDE Wiki for more articles. You can also report an issue or request a new feature.